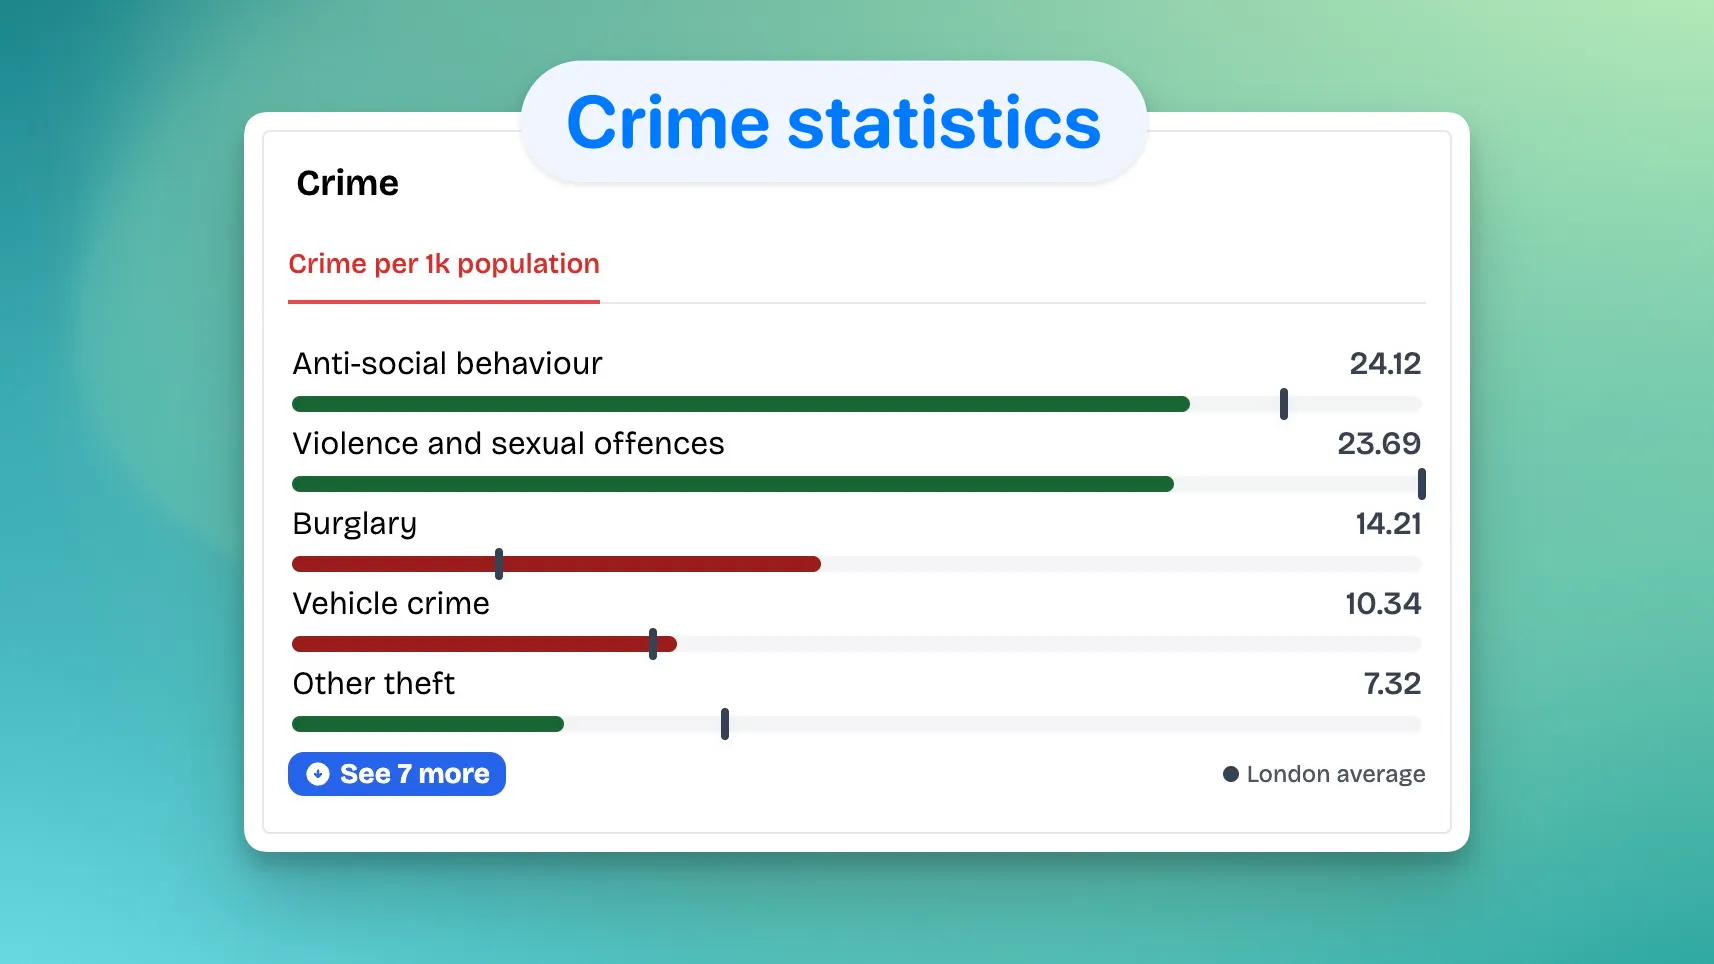
We just launched detailed crime statistics for every postcode and area in Area360. You can now see a crime per 1,000 population breakdown by category (anti-social behaviour, vehicle crime, violence and more), right alongside your usual area profile.
This gives you a clearer, more granular view of local risk and how it compares to the wider region.
Raw crime counts are easy to misread. A large area may show more incidents just because more people live there. The new view normalizes by population and surfaces category detail, so you can answer questions like:
Open any postcode and scroll to Area Profile → Crime to see the breakdown. The values are per 1,000 residents, and the visual marker shows how the area compares with the regional baseline.
On area profiles (ward, council, region), the same breakdown appears in the Crime section so you can compare neighborhoods at different scales.
If you’re shortlisting properties, this gives you a quick, data-driven way to compare safety profiles between neighborhoods without losing the context of population size.